Nestled in the heartland, the Metropolitan Utilities District (District) serves over 620,000 customers across a sprawling service area encompassing Omaha, Nebraska, and its surrounding communities. With a vast network of over 3,000 miles of water mains, as well as natural gas infrastructure, ensuring resilience and reliability is a core mission to the District. Enter the Linear Asset Management Plan (LAMP), a data-driven initiative powered by Aquanuity AquaTwin Asset software.
The District’s infrastructure faces diverse challenges. Aging pipes, environmental factors, and increasing demand necessitate proactive management. Traditionally, renewal decisions relied on limited desktop assessments and historical break data recorded on paper maps, which was often reactive and resource intensive. The LAMP revolutionized this approach, employing system wide data empowered by ArcGIS Pro and AquaTwin Asset to prioritize essential maintenance and mitigate the most risk.
Getting to the point where this vast dataset could be leveraged started with a digital transformation back in 2008 through the conversion of legacy MicroStation foreman pages into an Esri geodatabase. The District also developed a process to digitize new facilities into the geographic information system (GIS) database. Fast forward to 2019 when the asset management division was formed, the District worked to digitize over 15,000 paper leak reports into its GIS to be used for subsequent analyses. These leak reports consist of essential information recorded by field maintenance crews who respond to water main breaks.
This conversion of physical assets into a digital environment laid the groundwork for the creation of a hydraulic model and subsequent risk model for linear assets.
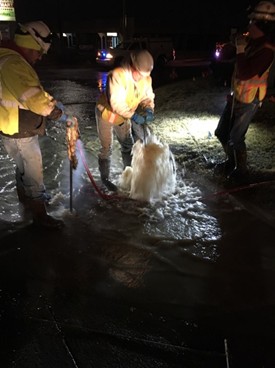
MUD Crews responding to a water main break
In 2019, the District wanted to leverage their existing GIS data to develop a water system hydraulic model of their entire distribution system and hired HDR Engineering to do just that. The first step in the hydraulic model development process was to perform a comprehensive review of the District’s GIS database for readiness of the data for hydraulic model import. This is because water models have specific network connectivity requirements in addition to other unique data requirements. An initial review of the GIS database yielded a high number of network exceptions and inconsistencies for model import.
Following a comprehensive data reconciliation effort, the final GIS dataset was used to build the final model consisting of 104,000 pipelines and 96,000 junction nodes. The model was then calibrated through a series of 30 fire hydrant flow tests to adjust roughness coefficients and boundary-level model conditions until the model was calibrated within AWWA M32 guidelines.
The District currently uses AquaTwin Water for hydraulic modeling which allows them to leverage model output data directly into the risk model. One of the primary reasons why AquaTwin Water was chosen was its complete integration in the ArcGIS Pro environment. The fact that there were no external data tables, that it supported Utility Network out-of-the-box, and that it natively used ArcGIS Pro selection and other tools was important to the District.
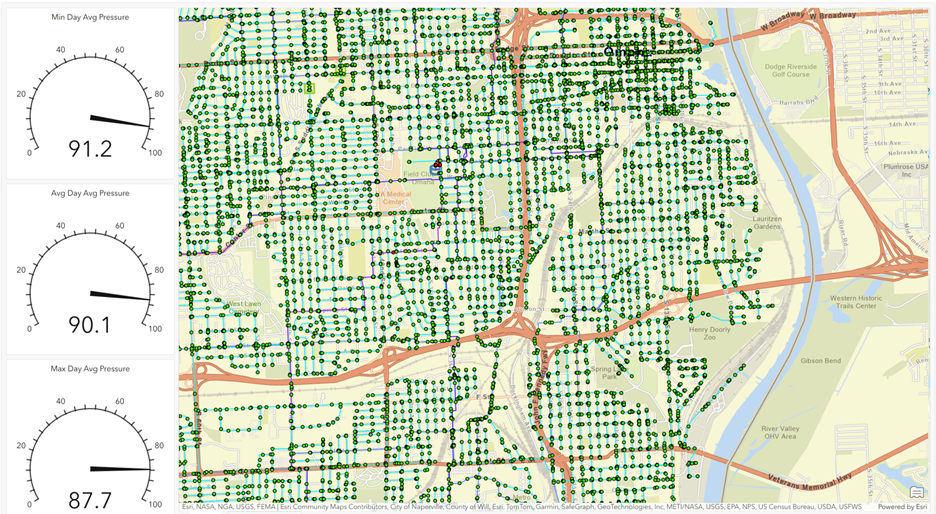
AquaTwin Water System Map
Stats:
HDR Engineering was also hired to develop the District’s LAMP, which included a comprehensive risk model leveraging several GIS datasets and the outputs of the new hydraulic model.
Using a statistical approach, Likelihood of failure (LOF) and Consequence of failure (COF) factors were developed based on various pipeline attributes as well as external and environmental attributes. The likelihood of a main failing was attributed to the mains break rate, pipe cohort (material and vintage), diameter, pressure, and the number of service connections. The consequence of failure was quantified using the number of customers affected (and how impactful a disruption would be to them), as well as the roadway type, zoning where the main is laid, and the failure mode of the pipe cohort.
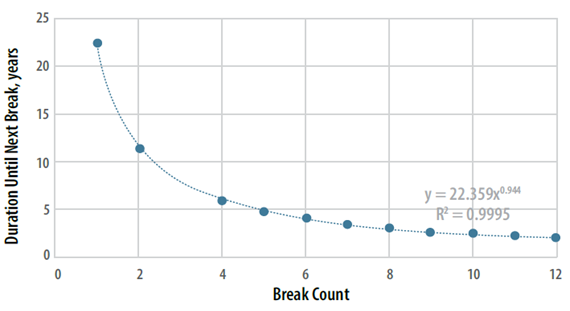
Duration to Next Break Curve
Developing such a model for a system of the District’s size was a massive undertaking, but the quality of the GIS data produced factors with a high degree of confidence. For instance, the LOF factor for break rate was based on the “duration to next break”, or to put it in other words, how long before a main that has broken will break again. When applied to the whole system, this statistic was found to have a greater than 99% R-squared value, which is a measure of how well a model fits to a data set.
Next, the factors were built and applied to each of the 80,000 pipe segments in a massive spreadsheet. But how do you make this model more dynamic? Enter AquaTwin Asset empowered by Esri ArcGIS Pro.
By design, a software solution wasn’t initially scoped into the LAMP project. The District wanted to ensure the risk model would be built with a strong foundation and not built around any particular software. However, this approach would require that the chosen software would need to be user friendly and versatile enough to effectively translate any nuances in the factors that were developed. AquaTwin Asset was that software.
Using AquaTwin Asset’s simple user interface, directly integrated with ArcGIS Pro, District staff were able to translate each factor directly into an AquaTwin Asset risk model that utilized the dynamic GIS data and AquaTwin Water Hydraulic model data directly. AquaTwin Asset has the flexibility to build factors using pipe attributes directly, or by referencing external tables.
The District’s model was created in model builder to combine several GIS features into a single, comprehensive table that could be leveraged for easy updating of the risk model. This model combined service taps, break rate, and break count and normalizes the data based on the age of the water main. The results are then fed into the AquaTwin Asset model.
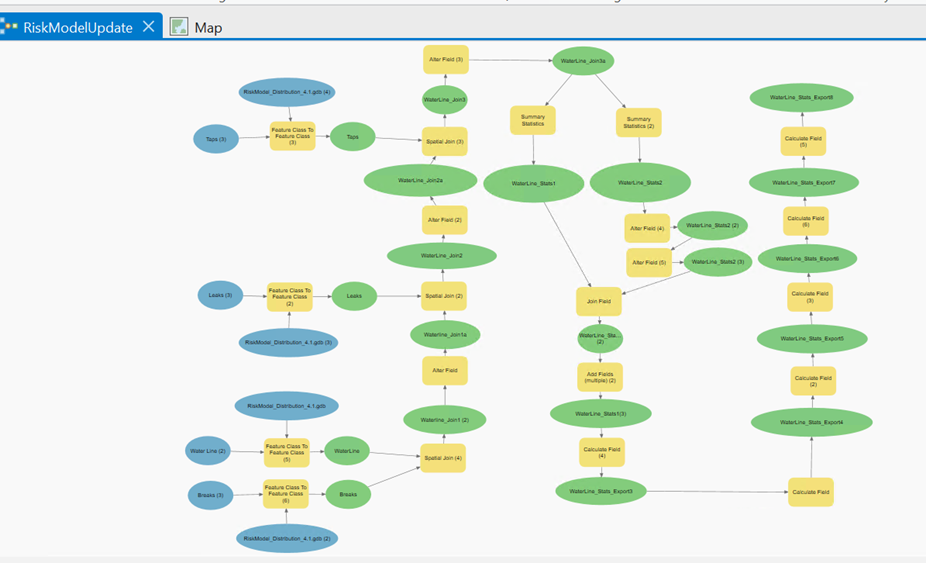
Model to Generate LOF Table Data
The consequence of failure factors utilized a very powerful tool within AquaTwin Asset called Saved Selections. This allows the user to use out-of-the-box ArcGIS tools to select pipe features, in this case line features representing water mains, save those selections and use them to assign risk scores.
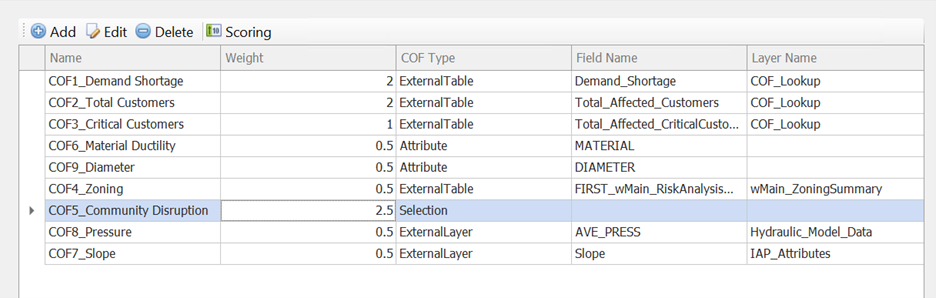
District COF Factors
In the District’s Risk model, the “Community disruption” factor combines several variables together including roadway type, proximity to buildings and railroads and whether the main was installed in a casing pipe. Saved Selections allowed the District to create a selection containing all the permutations of this factor for each score value and reference them directly into the model. The “Material Vintage” LOF factor uses a similar matrix to create a complex factor which combines pipe material, exterior coatings, and when the pipe was installed.
AquaTwin Asset then allowed for flexibility when combining LOF and COF into a risk priority score. The software allowed for either an additive or multiplicative approach and gave the user flexibility to utilize either of the results.
Since the software operates within the same 64-bit environment as ArcGIS Pro, the results are produced very quickly, with over 1 million calculations taking only a couple seconds and producing an easy to digest table of results. This table is also saved as a stand-alone database table within the Geodatabase and key fields can be appended directly to the feature class for easy thematic mapping of the results. It is also very easy to utilize Esri’s ArcGIS Pro Dashboards to display results, as shown below.
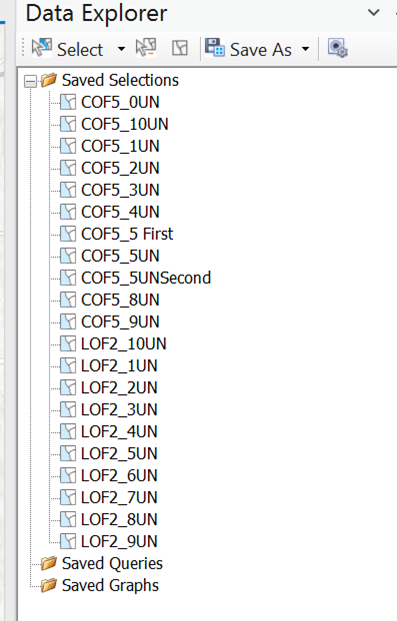
Saved Selections Panel
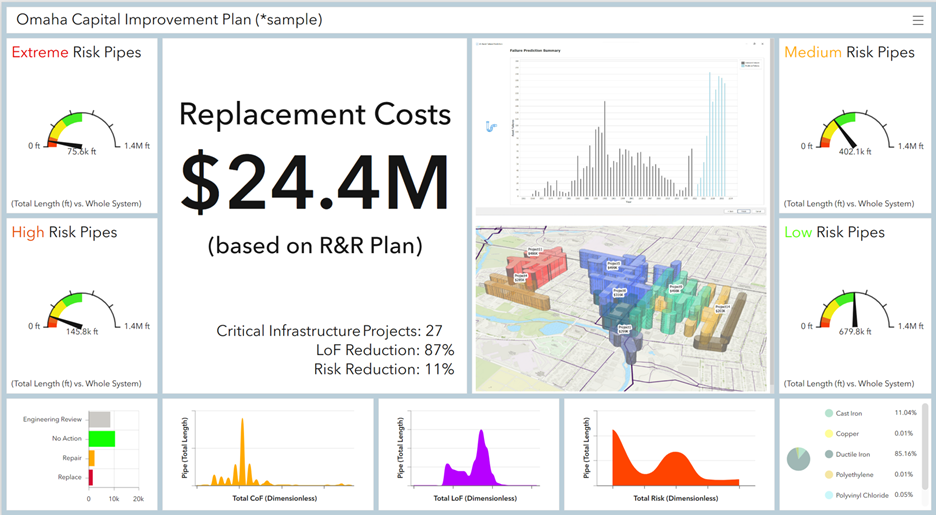
Dashboard of Pipe Replacement Costs
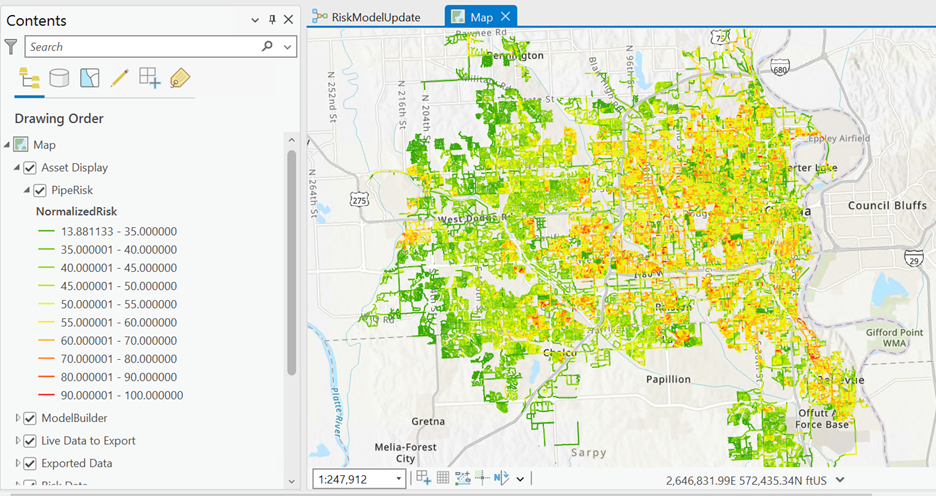
System Distribution Risk Map
The Linear Asset Management Plan has proven to be an invaluable tool for selecting both water main renewal projects and condition assessment projects, and to monitor areas of highest consequence for active water leaks. Using the outputs from the AquaTwin Water and Asset softwares, District Engineers can select water replacement projects that encompass the highest risk assets. Since it isn’t always economical to replace just one high risk block of water main, Engineers can select surrounding medium risk mains to create a project with more economy of scale. Doing so unfortunately reduces the amount of overall risk mitigated, but within AquaTwin Asset, users can produce a weighted average risk for these selected project areas so that priority remains focus on mitigating the most risk with the added benefit of being more cost effective.
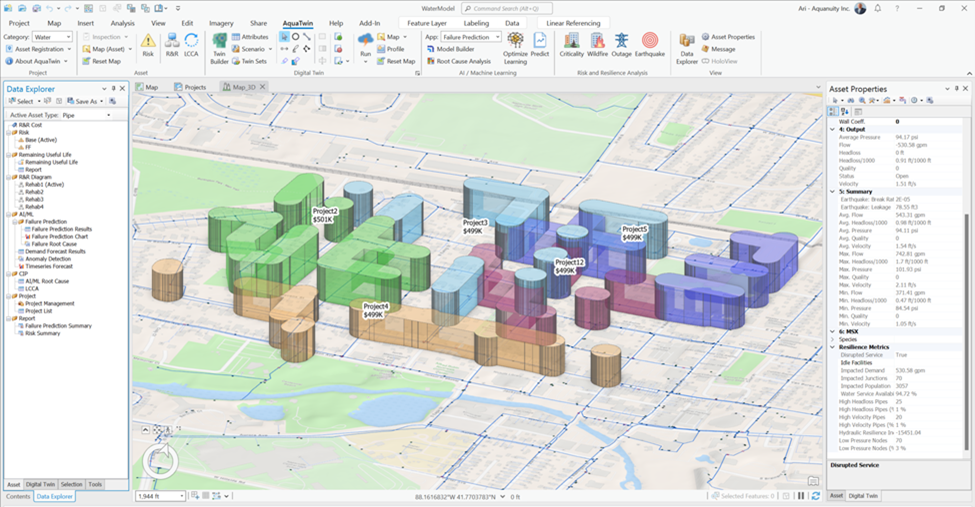
Prioritized Projects based on Weighted Average Risks
Combined with annual goals and budget constraints, projects can easily be sorted into years for replacement and assigned a replacement method/material that best suits the area. This same process is used to select condition assessment and leak monitoring project areas, but with more focus given to consequence of failure rather than overall risk.
To date, the District has used AquaTwin Water and Asset separately, each for their own purpose. Future risk analyses can be done with both programs working together. Since all input and output data from both programs are stored natively in Esri’s geodatabase, it is easy and straightforward to include hydraulic model results in the development of pipe risks. Calculated output such as maximum pipe velocity or headloss, as well as minimum or maximum pressure, or other model output values can easily be incorporated into COF and/or LOF calculations. Doing so provides another layer of reality to recommended output results and conclusions.