Riverside Public Utilities – Implementing AquaTwin Asset for Pipe Replacement Prioritization

Background – Historic water rights

Riverside Public Utilities is a city-owned utility, providing water and power to the residents of the City of Riverside, California, with over 66,600 water service connections. The city is unique because their historic water rights have enabled them to be water independent since 2009. With over 826 miles of distribution pipelines, the City of Riverside must carefully weigh relevant factors as they move through their pipeline replacement program while remaining fiscally responsible.

This case study explores Riverside’s transition of their horizontal asset model to AquaTwin Asset for improved reporting and visibility and their plans to use GIS information to fine-tune their model of pipe longevity.

Challenges – Prioritization of main replacements

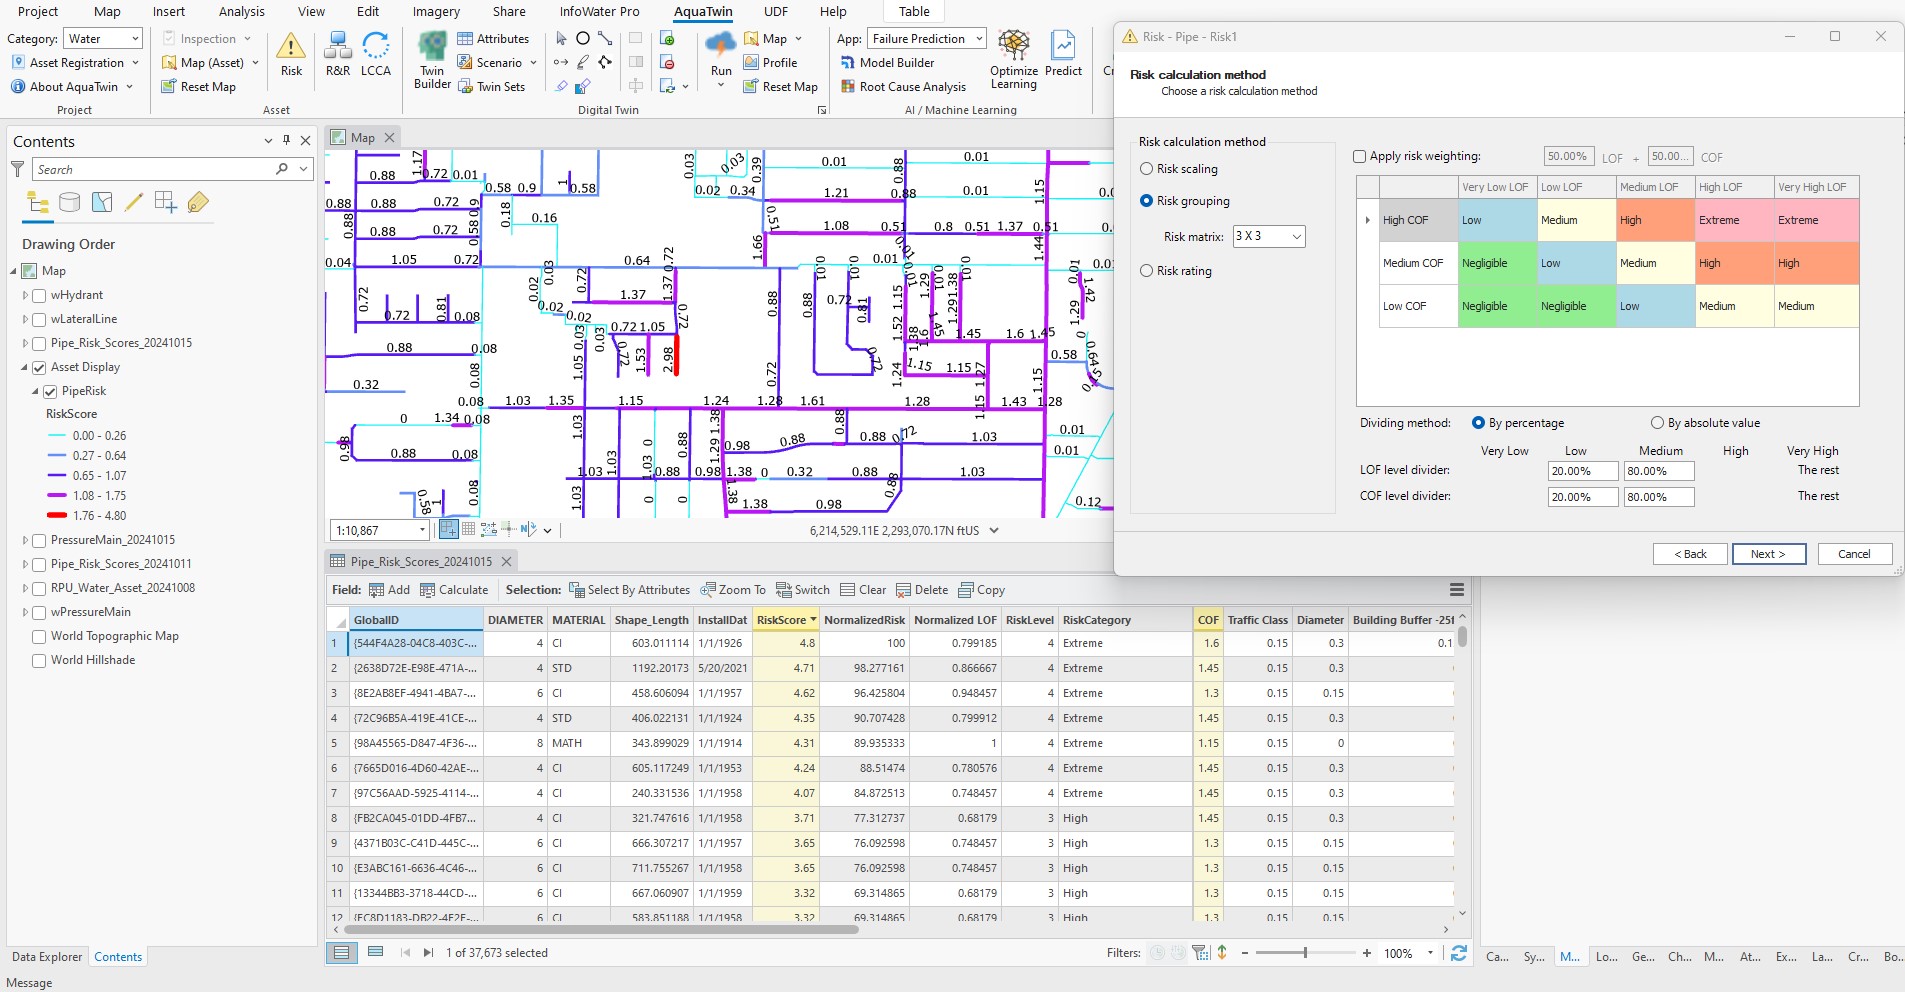
Before implementing AquaTwin Asset, Riverside was using a spreadsheet-based decision tree to calculate their Business Risk Exposure (BRE) and identify which pipes were the highest priority for replacement. The city needed a new solution that would enable them to present live results to stakeholders and add new factors to their model to more accurately predict each pipe’s likelihood of failure.

  • Spreadsheet-based model was difficult to update: Riverside Public Utilities calculates BRE for each section of pipe using the probability of failure multiplied by the consequence of failure. The model includes a number of pertinent factors including the age of the pipes, previous leaks, the traffic rating of the street, proximity to structures and location under sidewalks, medians, and railroads. Data for each factor had to be manually updated each time they ran the analysis.
  • Need for more rigorous and comprehensive model: This model that has been used by the city for the past 14years worked well, however, there are some anomalies that don’t fit with the current model. For example, the city is seeing greater failure rates in 1950’s cast iron pipes compared to pipes that were put in before WWII. Riverside wanted to update their model to include material types, with a different probability of failure curve for each material type. They also wanted to add active soils and the presence of groundwater to their analysis, since these both affect pipe longevity.
  • Need for visibility and transparency: The Riverside Public Utilities team reports to a board of stakeholders, representing different neighborhoods across the city. Looking to the future, the team needed a data-based and visual way to show and justify their recommended investments in specific areas based on the expected pipe longevity and consequence of failure, especially with the increase in aging infrastructure, rising costs of construction and limited resources, along with a desire for more public transparency in decision making.

Solution – Visualization of decision tree model

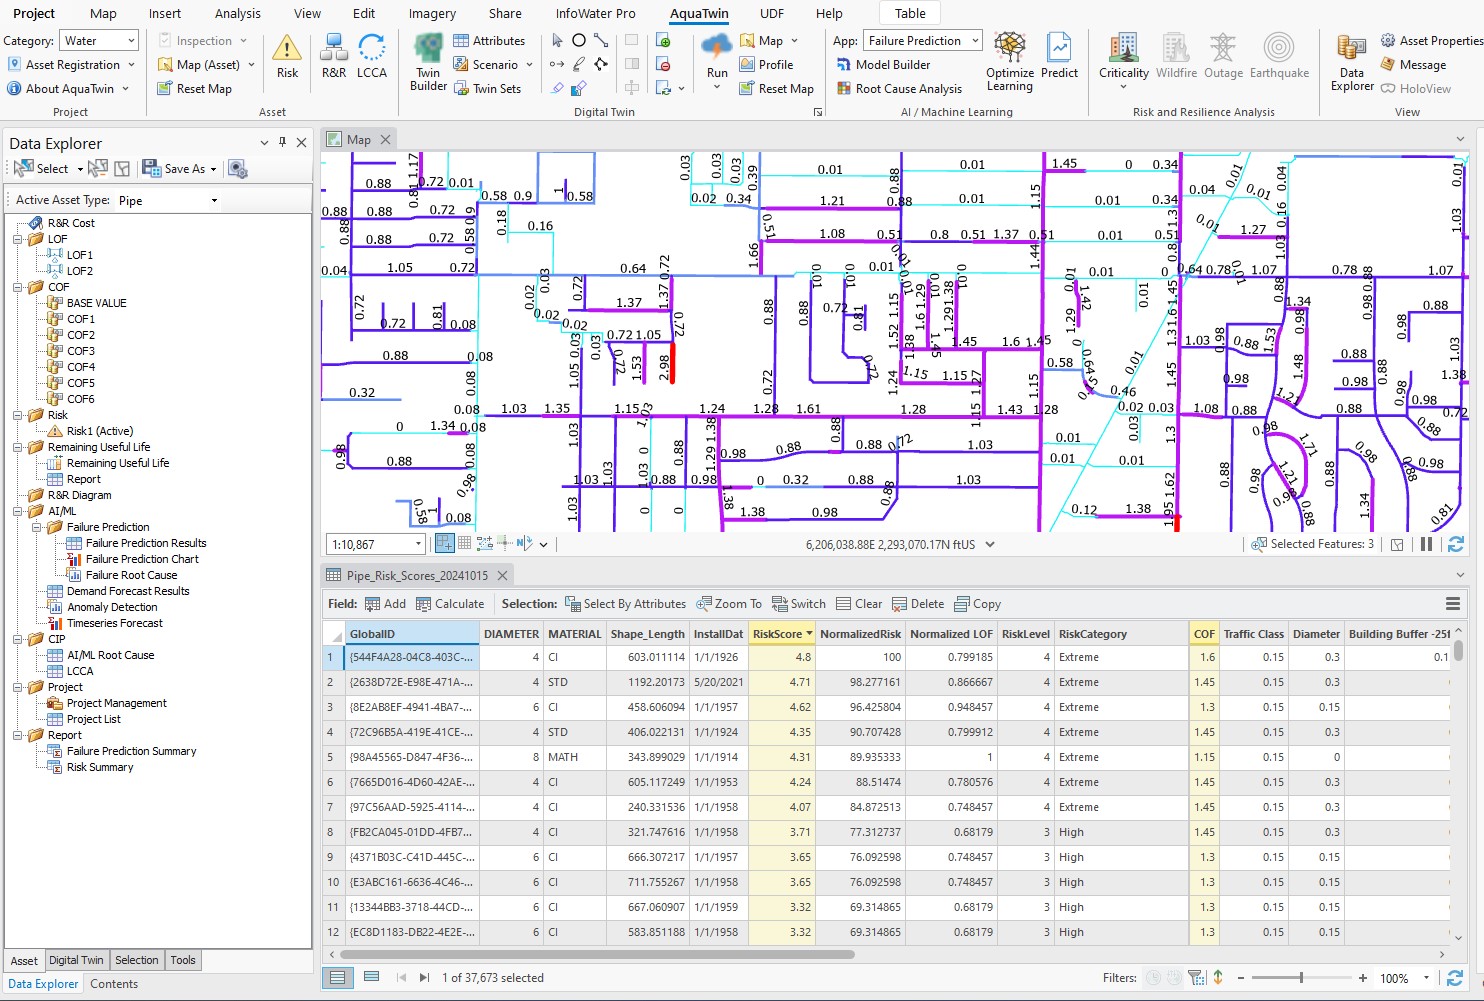
To achieve these objectives, Riverside chose to implement AquaTwin Asset. The software provides a graphical exhibit of the decision tree model that can be modified and presented in real time, allowing the city to present their recommendations to their stakeholders with the supporting analysis.

AquaTwin Asset is also fully integrated with ArcGIS Pro, making it easier to add new factors for analysis. As they set up the AquaTwin model, the team found that it is already much easier to update and visualize than their previous spreadsheet-based model. Blake Yamamoto, a Principal Engineer at the City of Riverside said, “AquaTwin Asset has strong integration with ArcGIS Pro and the reporting tools are fantastic, especially from the perspective of being able to provide documentation and justification of how segments of pipe for a particular project were selected.”

  • Reporting and Visibility: The Riverside Public Utilities team was impressed by the reporting features available in AquaTwin Asset. The new software will allow the city to show where updates are most urgently needed with the data to back up their findings.
  • Projecting cost of main replacement: AquaTwin Asset also shows a graph with the cost of pipe replacement. This will help stakeholders to understand the projected rate of pipe replacement and the projected cost to reduce the backlog.
  • Adding additional factors to the model: To update their model with new factors, the team first built and tested their existing decision tree model in AquaTwin Asset. They found that the results aligned well with their spreadsheet-based model. Additional data regarding pipe material is already stored within their ArcGIS Pro system. In the coming months, they plan to add three new factors to the model: material type, active soils, and areas of high groundwater. These additional factors will help them fine-tune their model and identify pipes that are the highest priority for replacement.

Conclusion – Transparency and improved decision making

The City of Riverside is fortunate in its beautiful location and historic water rights. Now with asset management tools from Aquanuity, Riverside Public Utilities is advancing their main replacement strategy. They are adding new factors to their Business Risk Exposure model for improved performance and looking forward to using modern reporting tools to communicate their findings with stakeholders.